Plotting results in the Signal Processing Tool
The Signal Processing Tool contains various methods to plot results of signal processing operations. The available plots are listed below.
Time Domain Plot - Signal
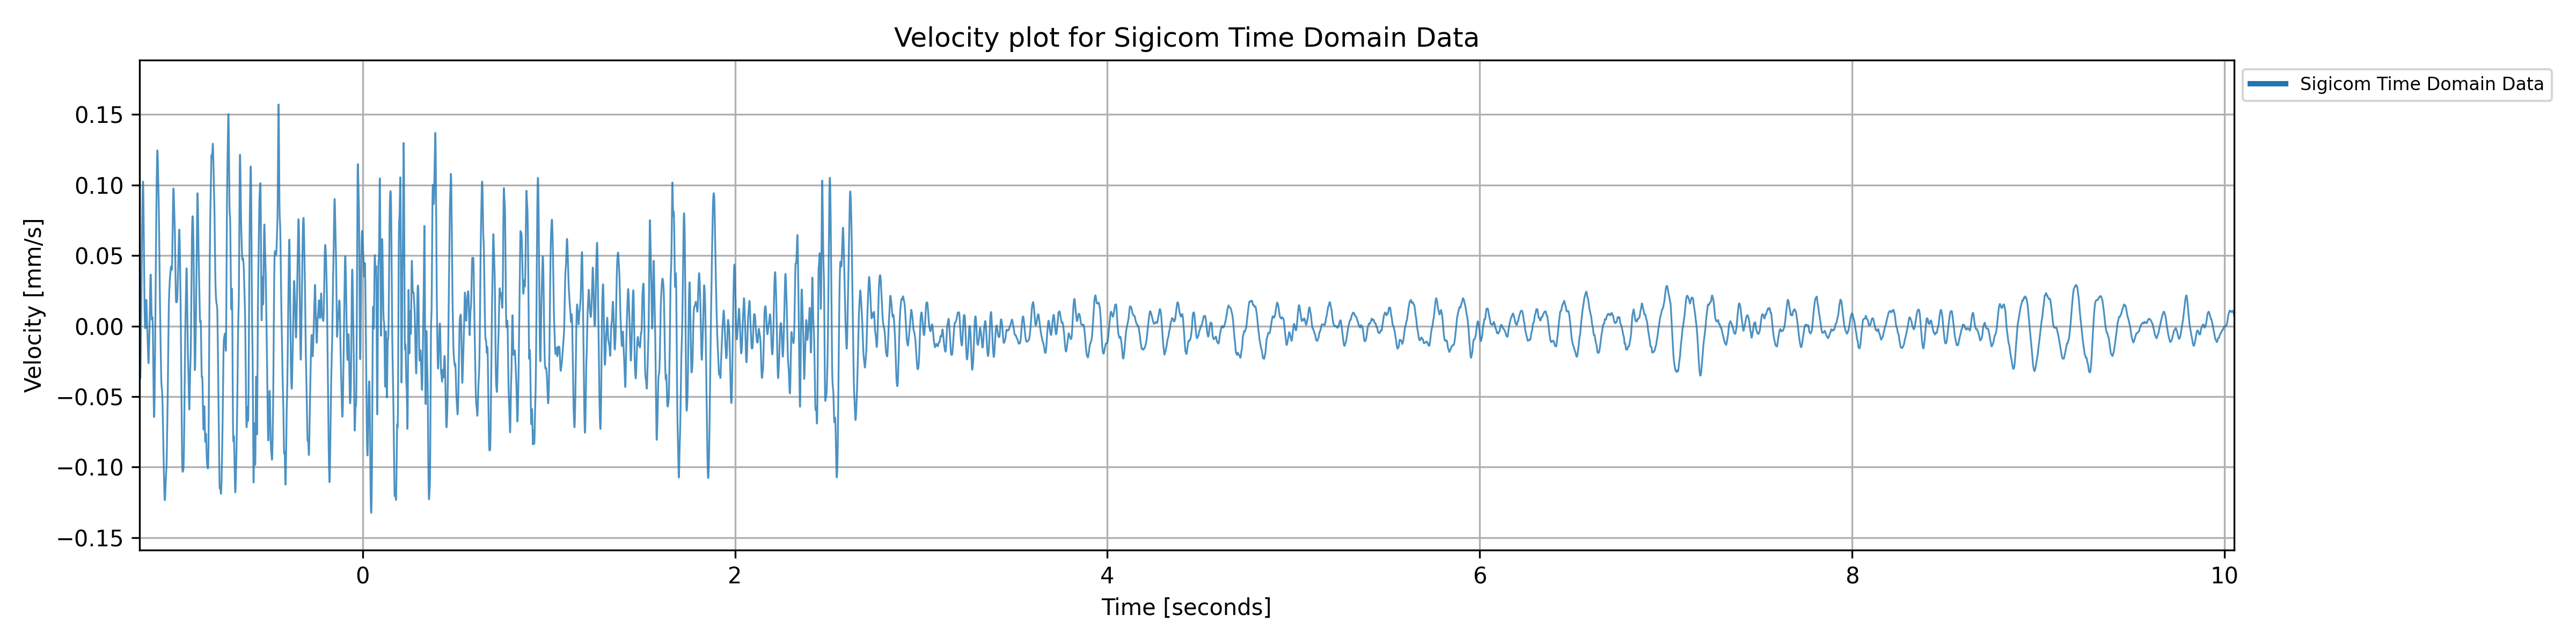
The method plot() is used to create
a plot of the transient data of the TimeDomainData object.
time_domain_data.plot(file='folder/figure_name.png')
Time Domain Plot - Signal composition 3D
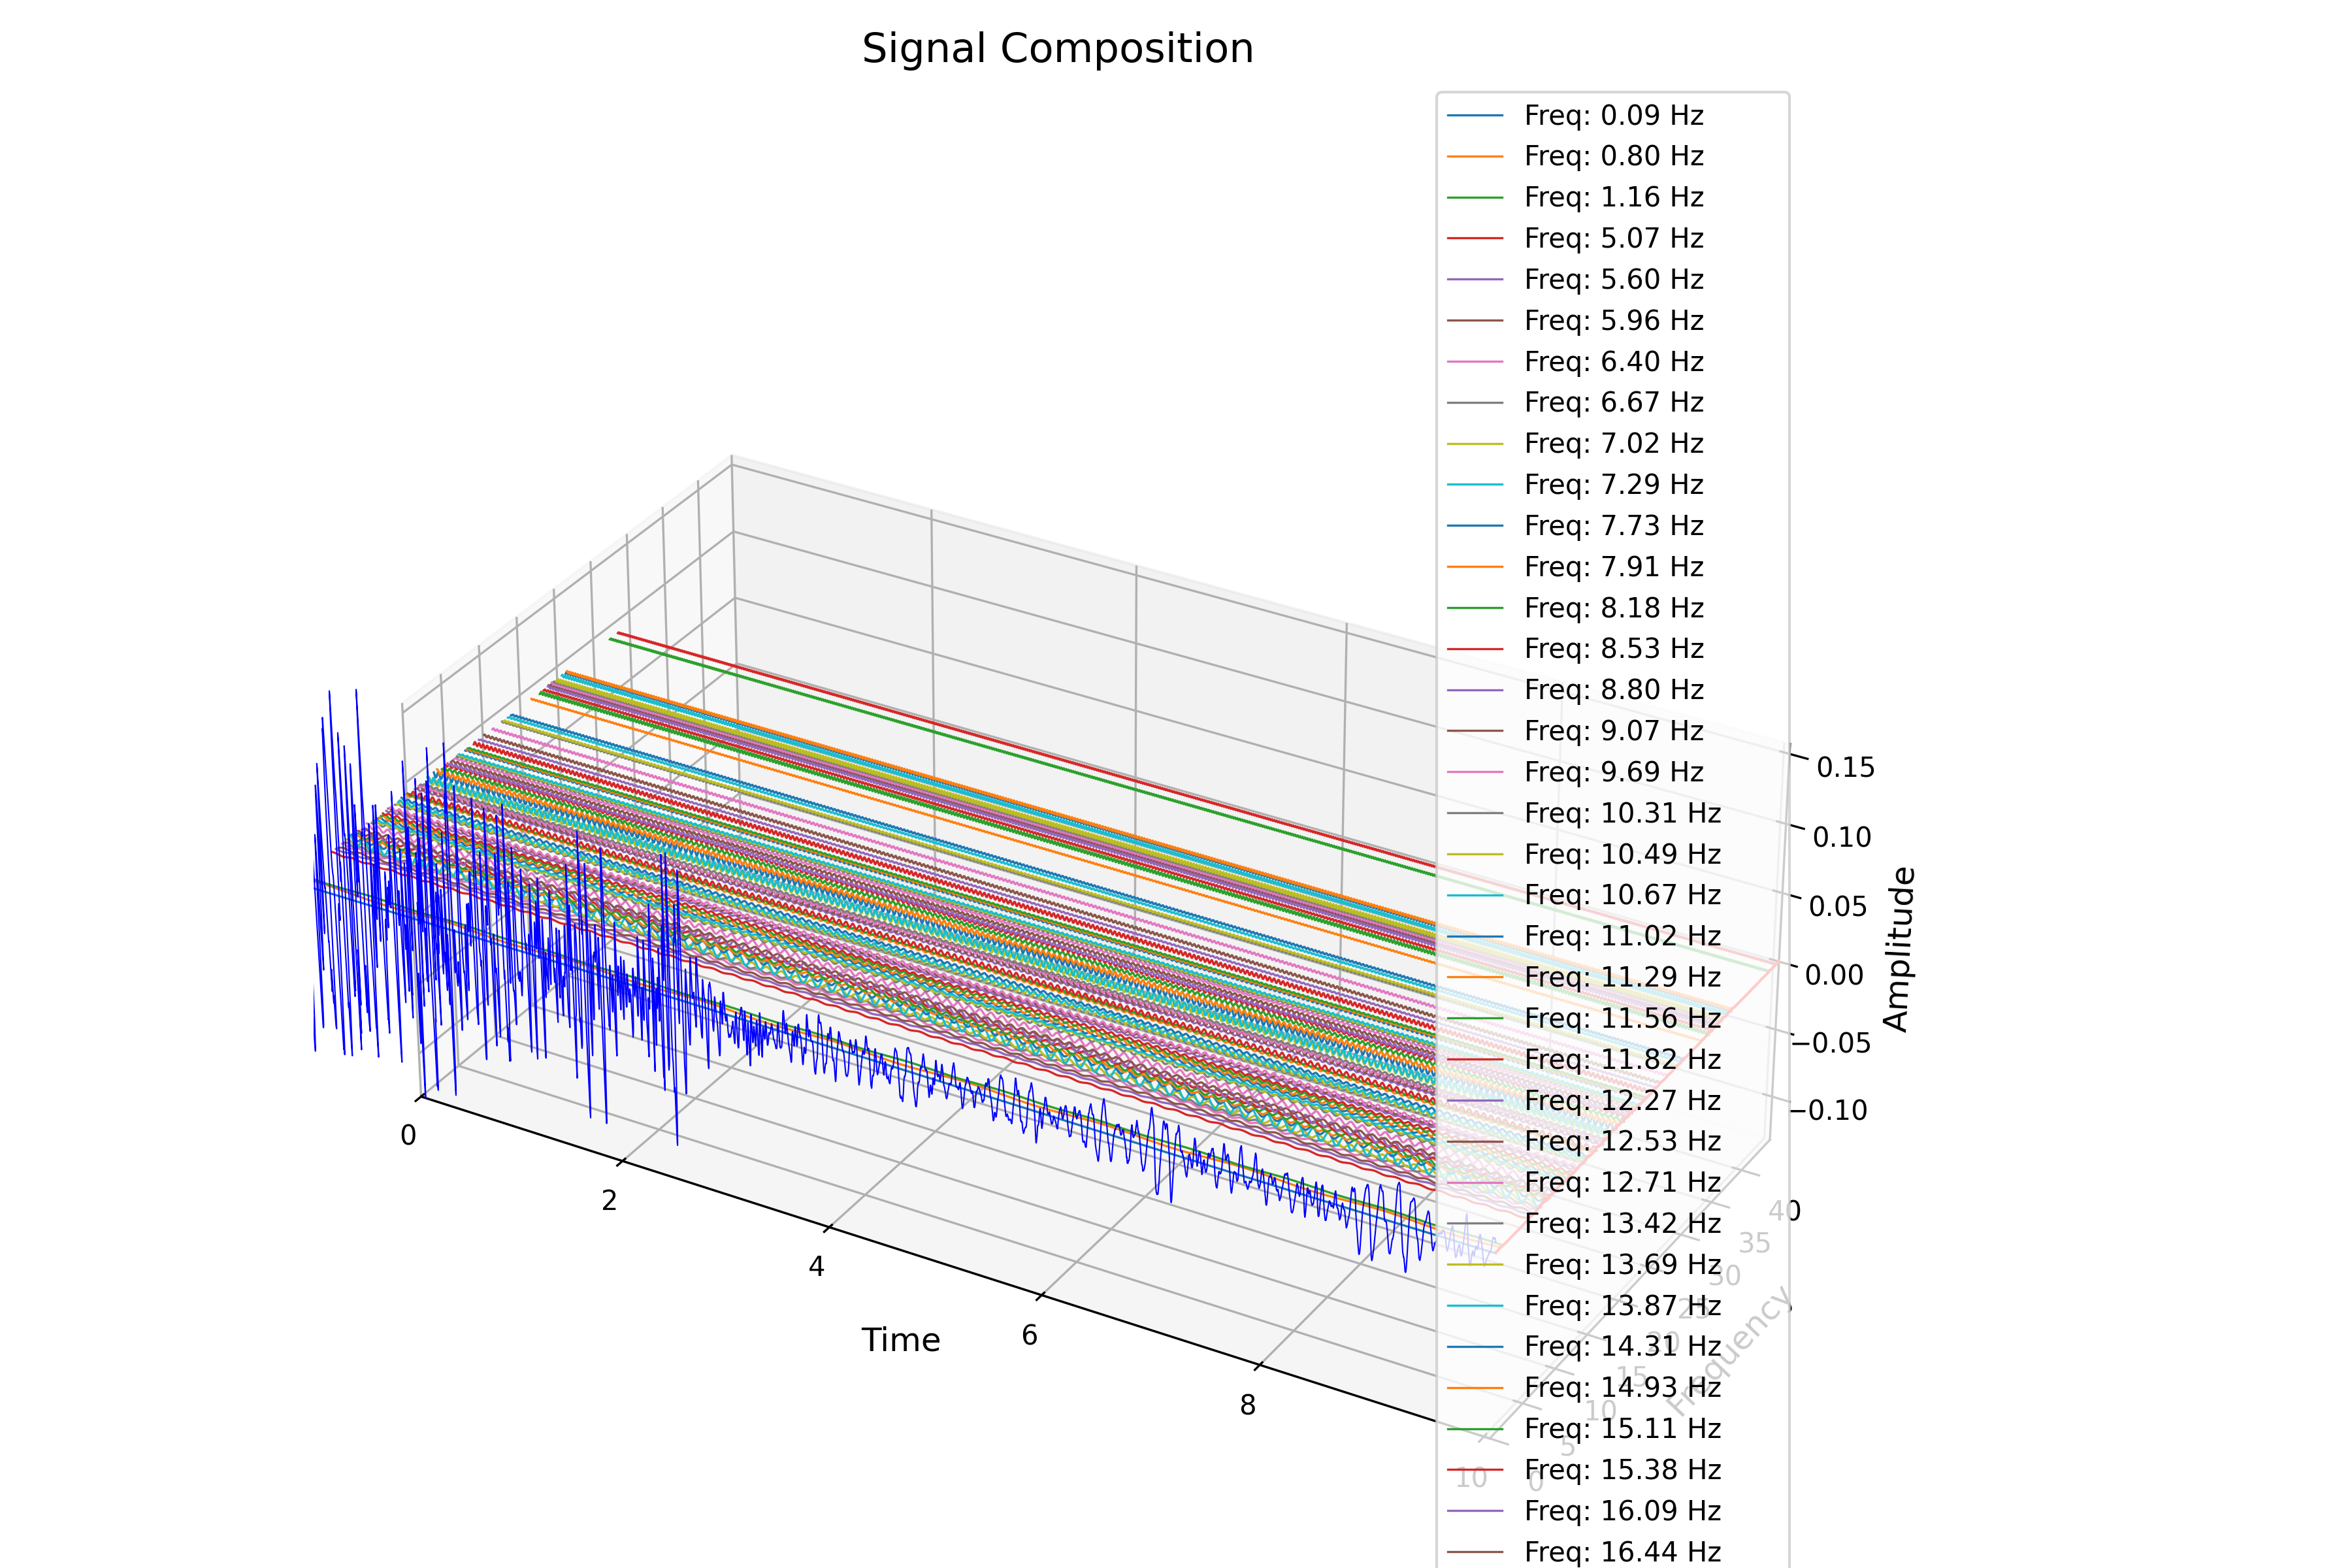
The method
plot_signal_composition_3d() is
used to create a 3D plot of the signal composition for the TimeDomainData.
time_domain_data.plot_signal_composition_3d()
Time Domain Plot - Octaves
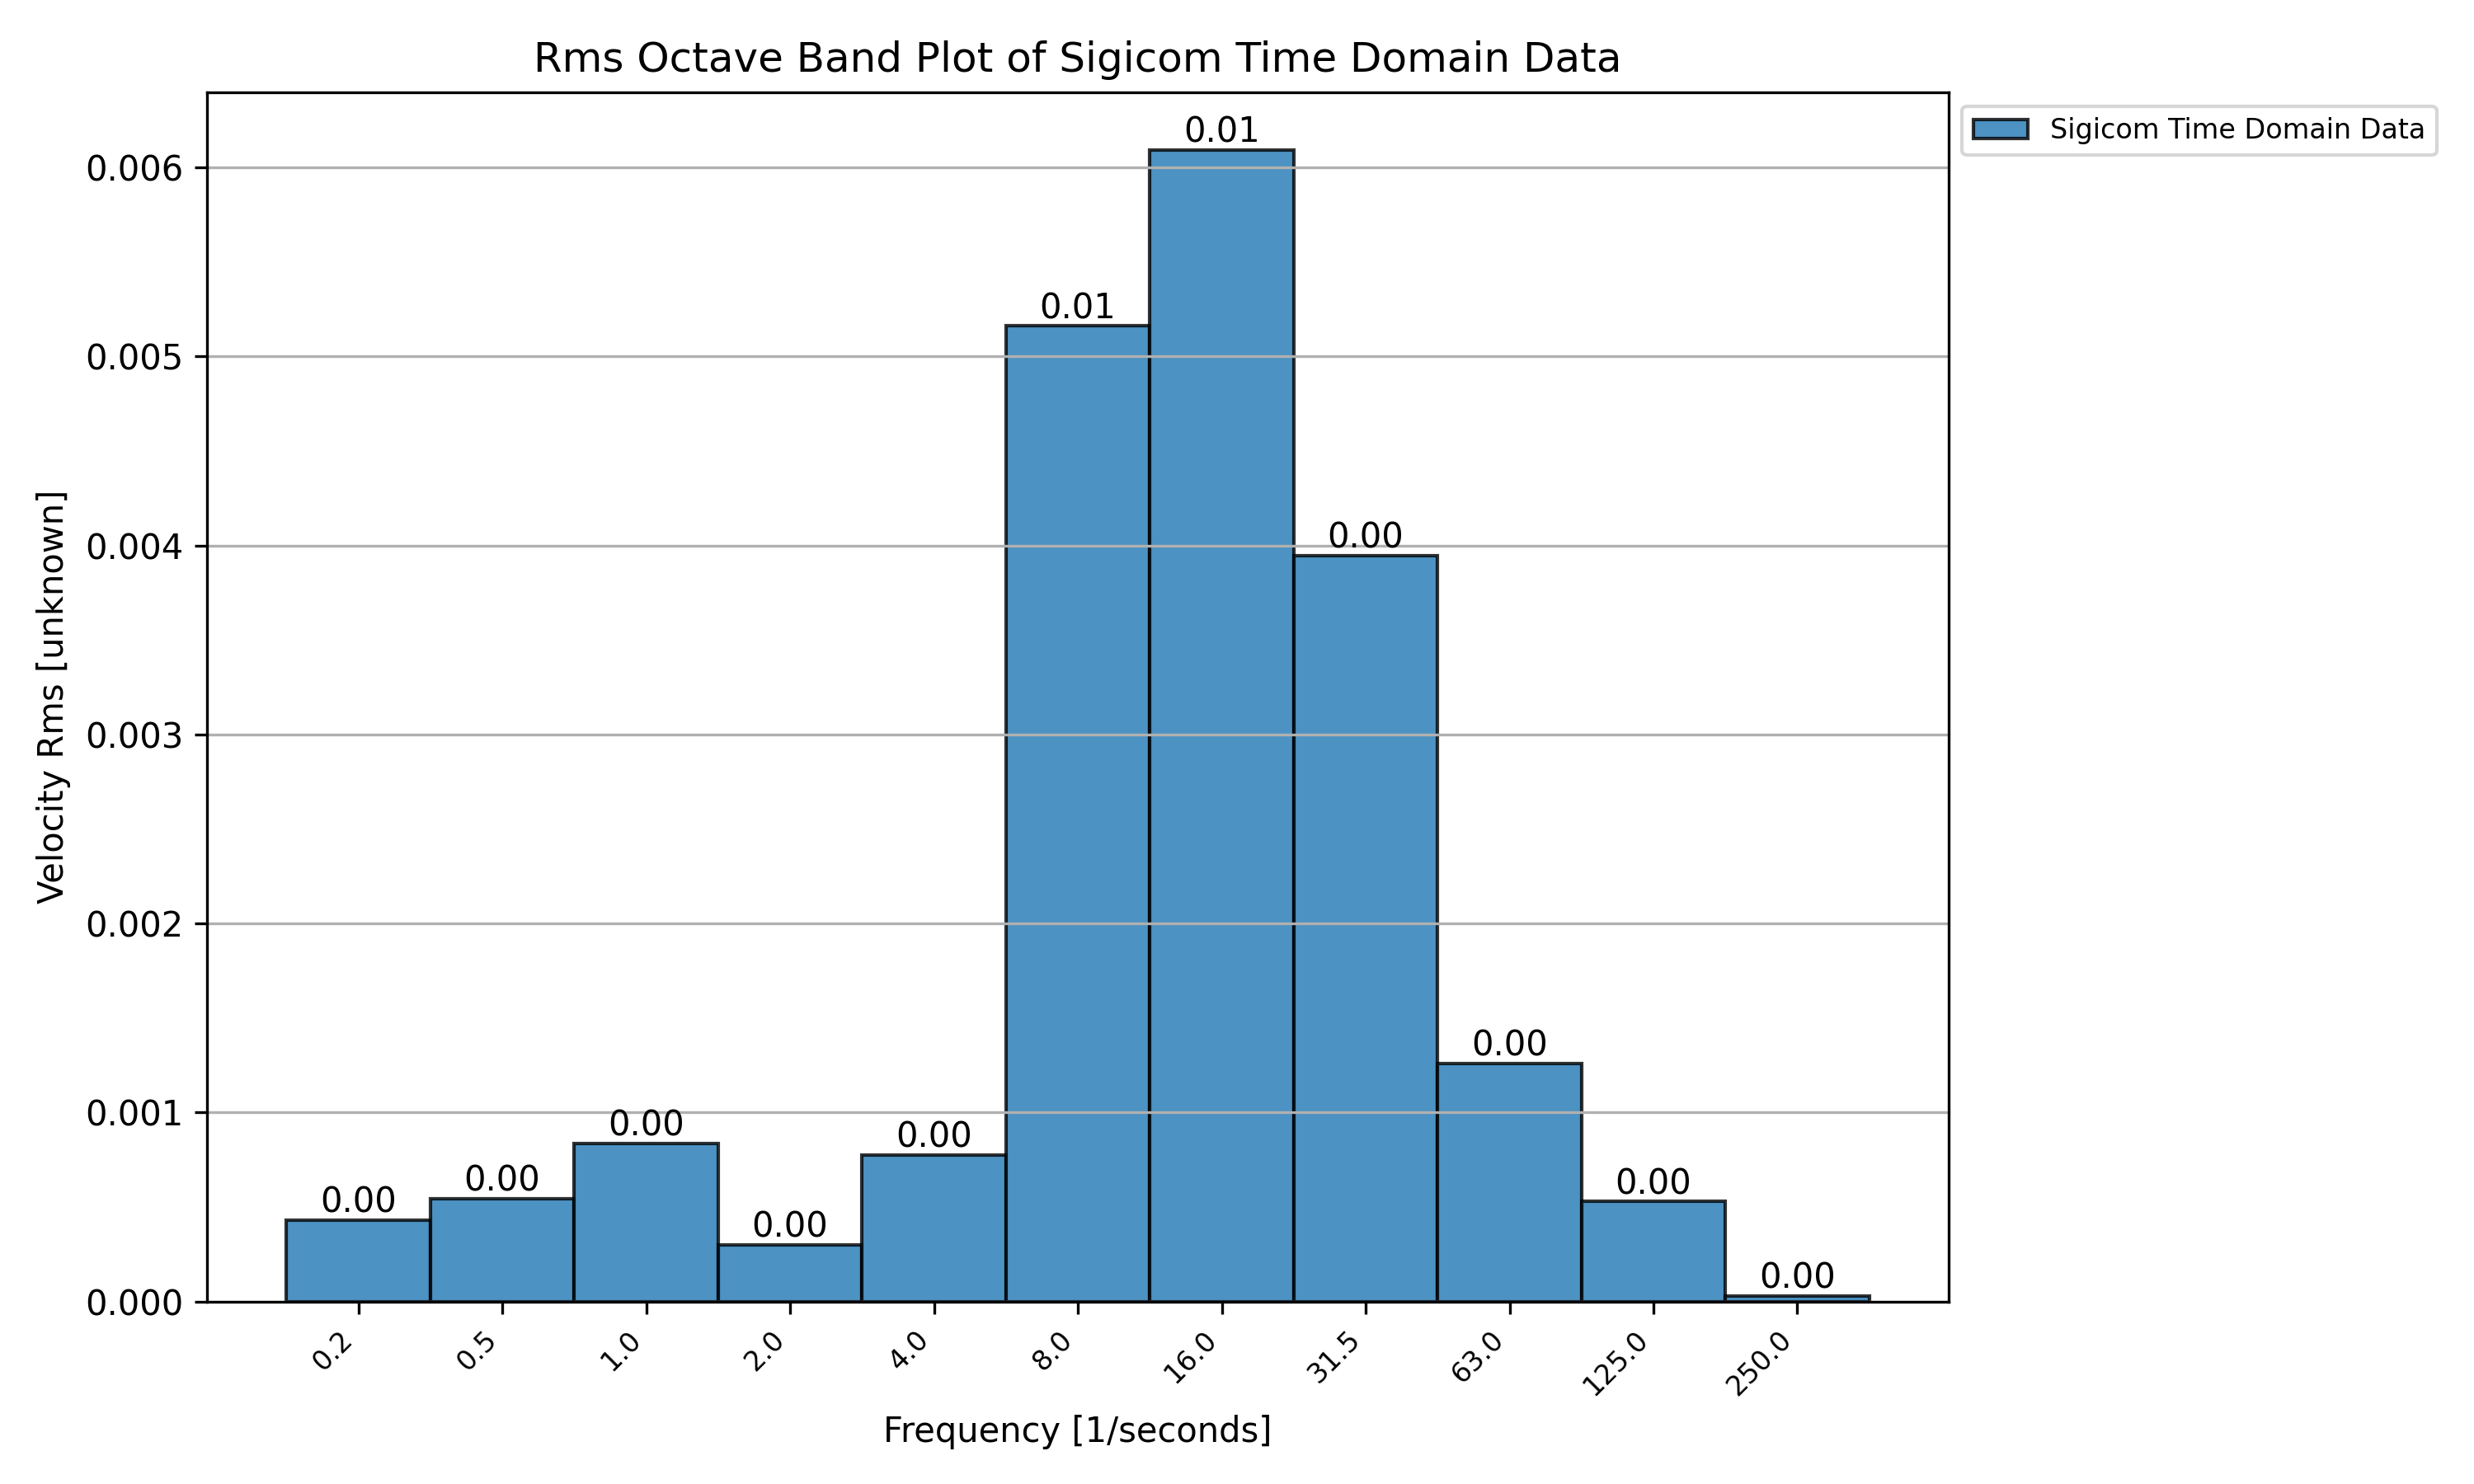
The method plot_octaves_tdd() is
used to create the octave or third-octave bands plot for the TimeDomainData.
time_domain_data.plot_octaves_tdd()
Time Domain Plot - SBR-B RMS values
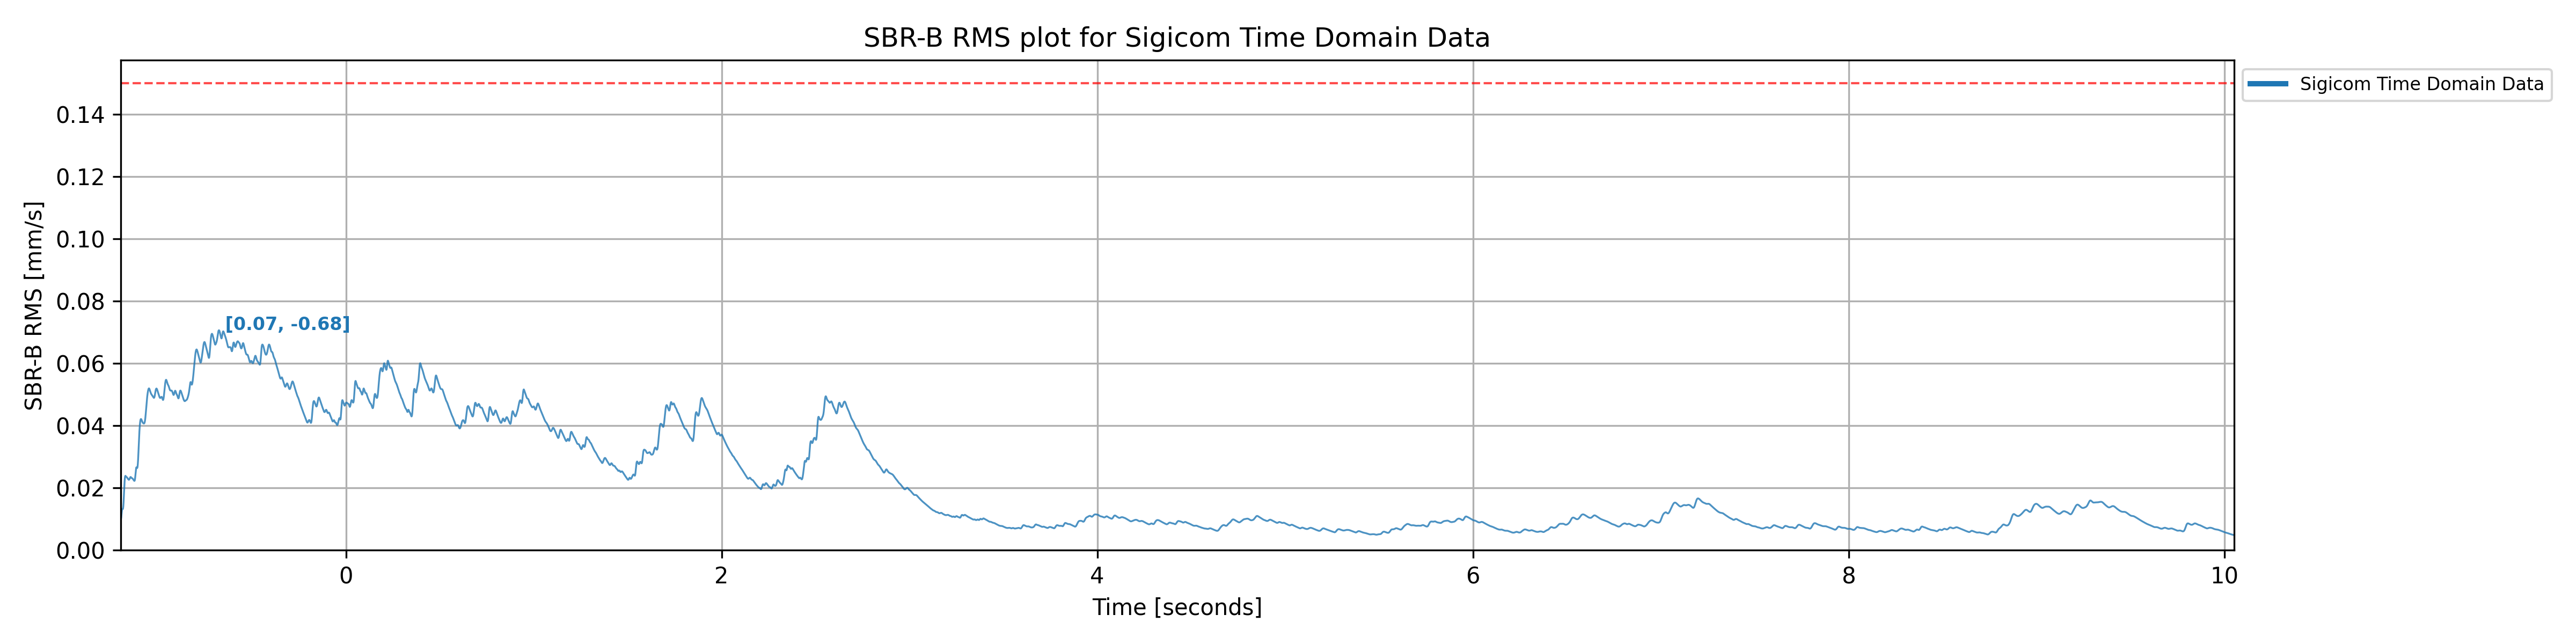
The method plot_sbr_b_rms() is used
to create the RMS plot for the TimeDomainData according SBR-B guideline. The method can also include limit values for
the SBR-B guideline, specifying the building type, time of day and activity level.
time_domain_data.plot_sbr_b_rms(limit_parameters=['office', 'day', 'A1'])