Creating spectra
Three options are available for the user to create spectra in the frequency domain:
Manual creation of a spectrum: The user provides the time and the amplitude values as lists.
Import spectra from a file: The spectra are imported from a (Sigicom) csv-file or xlsx-file.
Use built-in signal generators: Create a spectrum using one of the built-in spectra creators.
In this section these methods are explained in more detail.
Frequency Domain Data
In this tool, the spectrum is referred to as the raw frequency-domain data. It consists of two lists: one containing
frequency values and the other containing corresponding amplitude values. Additional metadata related to the spectrum is
stored in a FrequencyDomainData object,
which encapsulates information such as name, units, sampling rate, duration, and other relevant attributes. The setup of
the class is similar to the time domain data object.
The frequency domain data can be added to a collection of multiple spectra, which is managed by the
FrequencyDomainCollection class.
This class provides the functionality to manage multiple spectra and execute functions on all contained spectra. The
collection is added to the project instance.
Manual creation of a spectrum
Any spectrum can be provided manually by specifying the frequency and amplitude values as lists. The lists should be of
equal length. For this the function
create_frequency_domain_data() is used.
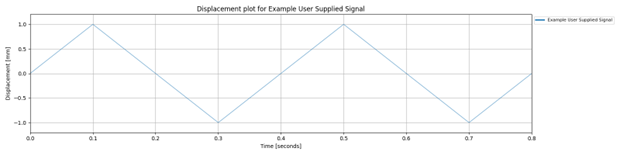
The following example creates a frequency domain data object by providing a spectrum manually (as lists).
frequency_domain_data = project.create_frequency_domain_data(
    name='Example User Supplied Signal',
    amplitudes=[0, 1, 0, -1, 0, 1, 0, -1, 0],
    time_stamps=[0, 0.1, 0.2, 0.3, 0.4, 0.5, 0.6, 0.7, 0.8],
    collection_name='Example Collection',
    amplitude_type='displacement',
    amplitude_units='mm',
    time_stamps_units='seconds')
Import Frequency Domain Data from a File
The Signal Processing Tool also supports importing frequency domain data directly from a file. Supported formats include csv and Excel (xlsx). The file should contain at least two columns: one for the frequency values and one for the spectrum values (e.g., amplitude, power, PSD).
Use the function
create_frequency_domain_data_from_file()
to import frequency domain data. This function requires the file path, column names or indices, units, and metadata
describing the type of spectrum.
frequency_domain_data = project.create_frequency_domain_data_from_file(
    file='path_to_your_file/spectrum_data.csv',
    frequency_column='Frequency',
    value_column='Amplitude',
    value_units='mm/s^2',
    name='Imported Spectrum',
    spectrum_type='amplitude',
    amplitude_type='acceleration',
    frequency_units='Hz',
    skip_rows=1,
    header=True,
    collection_name='Imported Spectra')
This will create a FrequencyDomainData object and add it to the specified FrequencyDomainCollection within the project.
Use built-in signal generators
The Signal Processing Tool includes several built-in signal generators that can be used to create common types of spectra. These generators are described in this section.
Harmonic Spectrum Function
The Signal Processing Tool allows you to generate a synthetic harmonic spectrum by specifying one or more harmonic frequencies and their corresponding amplitudes. This is useful for testing, simulation, or constructing idealised frequency domain representations.
Use the function
create_harmonic_spectrum_frequency_domain_data()
to create a FrequencyDomainData object based on harmonic components.
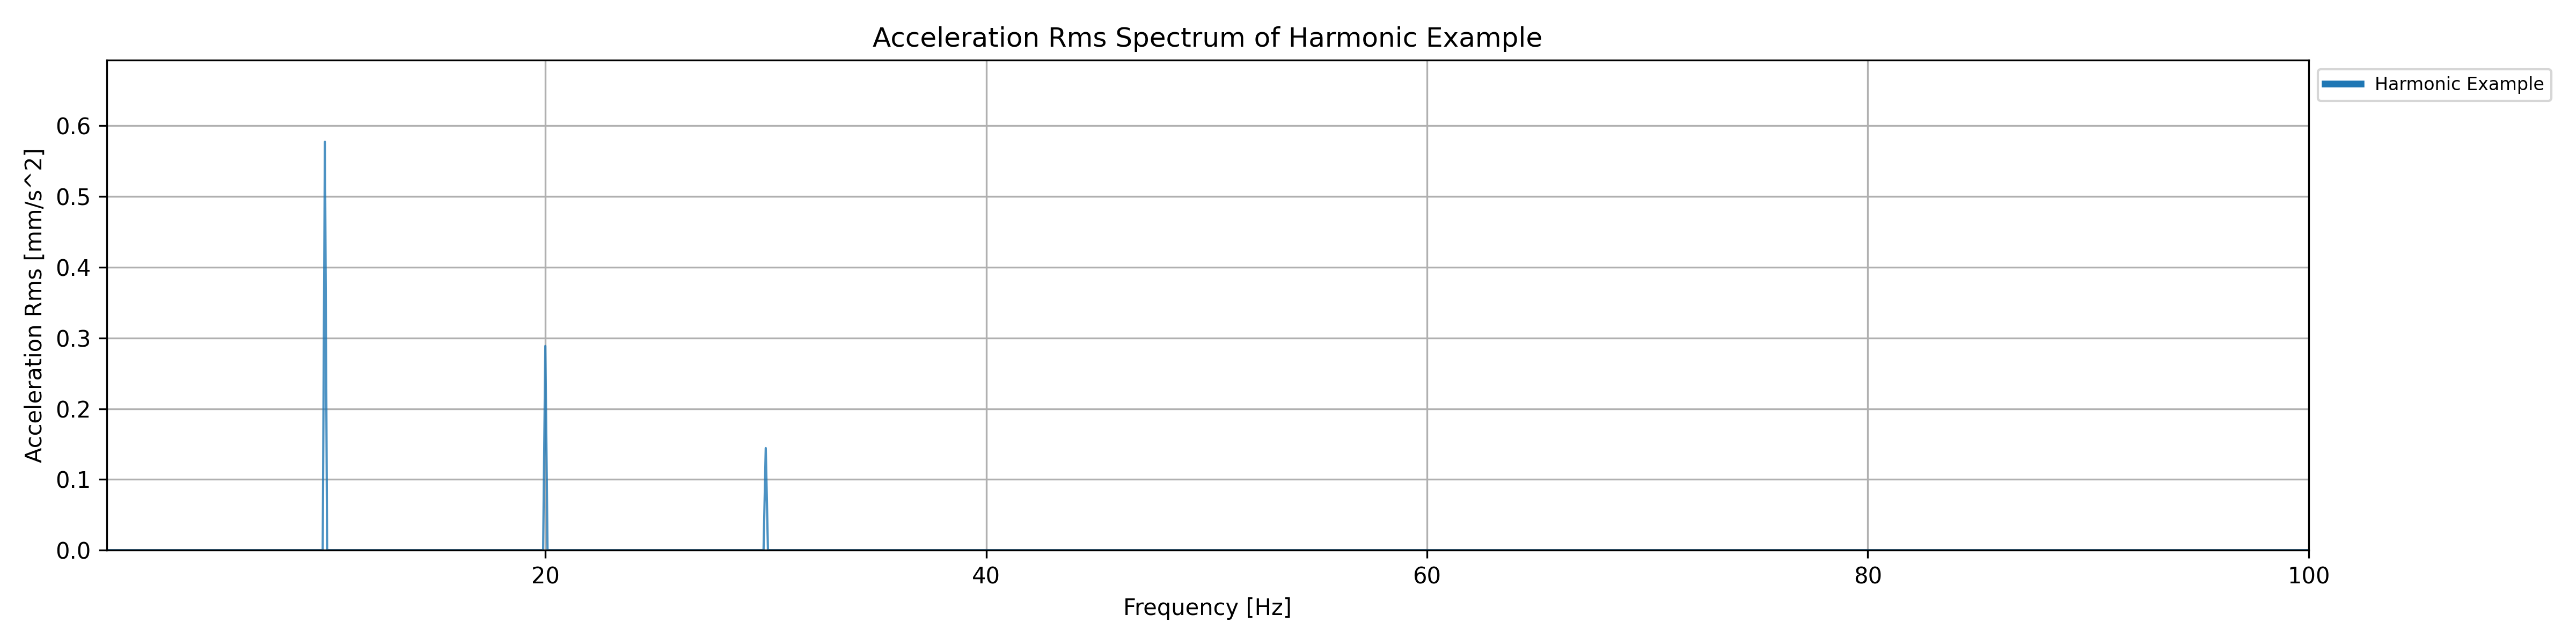
In this example a frequency domain representation of a signal composed of three harmonics (10, 20, and 30 Hz) with specified amplitudes and phase angles is created. The resulting FrequencyDomainData object is added to the ‘Generated Spectra’ collection in the project. You can also provide a single frequency and amplitude value to generate a single-tone harmonic spectrum.
frequency_domain_data = project.create_harmonic_spectrum_frequency_domain_data(
    name='Harmonic Example',
    frequencies=[10, 20, 30],
    amplitudes=[1.0, 0.5, 0.25],
    amplitude_units='mm/s^2',
    phase_angles=[0, 90, 180],
    lowest_frequency=0.1,
    highest_frequency=100,
    sampling_rate=0.1,
    amplitude_type='acceleration',
    spectrum_type='amplitude',
    frequency_units='Hz',
    phase_angle_units='degrees',
    signal_duration=10.0,
    window_used='hann',
    collection_name='Generated Spectra')
White Noise Spectrum Function
The Signal Processing Tool allows you to generate a synthetic white noise spectrum, which is useful for testing, simulation, or baseline comparisons. A white noise spectrum represents a signal that contains equal energy (or amplitude) across all frequencies within a specified range. It’s called ‘white’ by analogy with white light, which contains all visible wavelengths in equal intensity.
Use the function
create_white_noise_spectrum_frequency_domain_data()
to create a FrequencyDomainData object with white noise characteristics.
frequency_domain_data = self.project.create_white_noise_spectrum_frequency_domain_data(
    name='White Noise Example',
    amplitude_units='mm/s^2',
    lowest_frequency=0.1,
    highest_frequency=1000,
    sampling_rate=0.5,
    noise_amplitude=0.2,
    amplitude_type='acceleration',
    frequency_units='Hz',
    signal_duration=20.0,
    window_used='rectangular',
    collection_name='Generated Spectra')
This example creates a frequency domain dataset representing white noise with a flat amplitude of 0.2 mm/s² across the frequency range from 0.1 Hz to 1000 Hz, sampled every 0.5 Hz. The resulting FrequencyDomainData object is added to the ‘Generated Spectra’ collection in the project.